Navigation in Volatile Waters: Comprehensive Stock Market Sensex Analysis for 2026

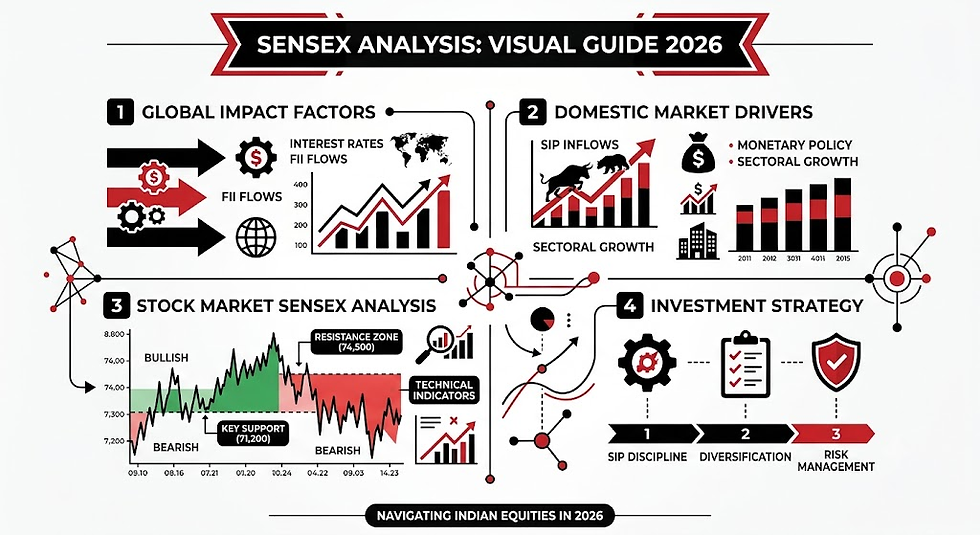
The Indian equity market has reached a critical juncture in 2026. After hitting all-time highs above 86,150 earlier in the year, the S&P BSE Sensex has undergone a notable correction, trading around the 71,500–72,500 range in October 2026. Investors navigating this shifting landscape require a clear, data-driven perspective to distinguish short-term noise from long-term wealth creation opportunities.
Conducting a thorough stock market sensex analysis reveals how global macro headwinds, monetary policy recalibrations by the Reserve Bank of India (RBI), foreign institutional capital flows, and domestic SIP liquidity interact to shape the broader Indian economy.
Nifty Prediction & Sensex Analysis for Tomorrow & market news | 9th October 2026 | 📈🚀
1. 2026 Market Overview: From Record Highs to Healthy Consolidation
The Indian equity landscape in 2026 has been marked by significant price swings. Following an intense bull run that pushed the 30-share benchmark index to its 52-week peak of 86,159.02, the market entered a phase of valuation normalization and global risk reassessment.
Key market levels and historical benchmarks highlight this transition:
52-Week High: 86,159.02 points
October 2026 Level: ~71,593.24 points
Year-to-Date Performance: ~ -9.37% correction across 2026
Historical Resilience: Since 1980, the Sensex has experienced an average intra-year drawdown of approximately 20%, yet ended 37 out of 46 calendar years in positive territory.
While short-term pullbacks test investor discipline, historical market cycles demonstrate that intra-year corrections of 10% to 20% are routine features of long-term wealth accumulation rather than structural breakdowns.
2. Macroeconomic Drivers Shaping the Sensex in 2026
Understanding the core drivers behind market movements requires evaluating both domestic fundamentals and international influences.
Key Factors Influencing Market Trajectory
Domestic Institutional Inflows (DII): Systematic Investment Plans (SIPs) from retail investors continue to provide a solid floor for Indian equities. Even during aggressive foreign selling phases, domestic mutual funds consistently absorb market supply with monthly inflows ranging between ₹10,000 crore and ₹12,000 crore.
Foreign Institutional Investor (FII) Realignment: FIIs have maintained a cautious stance in 2026, driven by elevated US Treasury yields, global trade tensions, and currency fluctuations. This net selling pressure in large-cap constituents has been a primary catalyst for the index's decline from its 86,000 peak.
Monetary Policy Stance: The RBI's repo rate recalibration to 5.50% reflects a balanced effort to anchor inflation around 4.82% while keeping economic growth on track.
Energy Prices and Currency Pressures: Crude oil fluctuations (Brent hovering around $100–$104/barrel) and rupee pressures against the US dollar have weighed on industrial margins, particularly across power-intensive manufacturing and auto sectors.
3. Sectoral Breakdown: Winners, Laggards, and Value Opportunities
A comprehensive stock market sensex analysis requires looking beyond top-line index figures to examine underlying sectoral dynamics.
Sector | 2026 Performance Sentiment | Key Drivers / Catalysts | Long-Term Outlook |
Information Technology (IT) | Neutral to Resilient | Client budget stabilization, AI implementation demand | Positive long-term, driven by digital transformation |
Banking & Financial Services | Consolidating | Strong credit growth, mild margin compression | Highly attractive valuation after recent pullbacks |
Capital Goods & Infrastructure | Outperforming | Government capex focus, renewable transition | Strong order book execution pipelines |
Automobiles & Transportation | Volatile | High energy input costs, EV transition expenses | Selective growth in premium and commercial segments |
Consumer Staples (FMCG) | Under Pressure | Urban demand slowdown, commodity price spikes | Expected recovery post-monsoon and festival season |
Large-Cap Weight Analysis
The performance of heavily weighted stocks within the BSE Sensex illustrates the current market divide:
Financial Giants: Leaders like ICICI Bank and HDFC Bank have undergone valuation compressions, creating compelling long-term risk-reward profiles for value investors.
Capital Goods & Industrials: Entities such as Larsen & Toubro continue to benefit from order inflows across domestic power and public infrastructure projects.
Energy & Conglomerates: Reliance Industries and IT leaders like Tata Consultancy Services have reflected broader global tech and energy market sentiment.
4. Technical Perspective: Key Levels and Risk Management
From a technical chart perspective, the BSE Sensex is consolidating within a crucial support zone.
Technical Indicators & Support Bands
Primary Support Zone (71,200 – 71,500): This price zone represents major historical support. A sustained hold above this range keeps the structural long-term bull market intact.
Immediate Resistance (74,500 – 76,000): For the Sensex to regain upward momentum, it must cross and hold above the 74,500 level on strong trading volumes.
Volatility Index (India VIX): Moderate spikes in volatility signal that while caution is required, panic selling remains largely absent, supporting silent accumulation phases.
5. Strategic Playbook for Investors in 2026
Given current market dynamics, navigating the Indian stock market requires a disciplined asset-allocation framework.
Recommended Investment Guidelines
Embrace Rupee-Cost Averaging: Historical rolling-return data demonstrates that 7-year investment horizons in Indian equities have yielded positive annualized returns exceeding 10% in over 85% of evaluated cycles. Continuing equity SIPs during market pullbacks maximizes long-term compounding.
Focus on Quality Large-Caps: Current market pullbacks have cleared speculative froth, making established large-cap companies with robust cash flows and low debt profiles attractive.
Maintain Cash Buffer: Keeping 10–15% of a portfolio in liquid fixed-income instruments provides the flexibility to capitalize on sudden market drawdowns.
Frequently Asked Questions (FAQ)
What does a stock market sensex analysis reveal about the current 2026 market correction?
A detailed stock market sensex analysis shows that the current 2026 market correction (~9% YTD decline from its 86,159 peak) is driven by global interest rate uncertainties, foreign institutional capital outflows, and elevated commodity prices. However, strong domestic retail liquidity via SIPs continues to provide structural support.
Is it safe to invest in the BSE Sensex during market pullbacks?
Yes, historical market data spanning four decades indicates that intra-year drawdowns of 10% to 20% are routine. Over 7-year holding periods, the probability of negative returns in broad Indian equity indices approaches near-zero, making pullbacks attractive entry points for long-term investors.
What are the major support and resistance levels for the Sensex in late 2026?
The key support band for the Sensex lies between 71,200 and 71,500 points. On the upside, immediate technical resistance is expected around 74,500 to 76,000 points.
How do foreign institutional investors (FIIs) impact the Sensex?
FII inflows and outflows influence short-term liquidity and price momentum, especially in heavy-weight stock components. However, rising domestic institutional investor (DII) flows have significantly reduced overall market dependence on foreign capital over recent years.
Take Control of Your Financial Future
Navigating financial markets requires continuous learning, disciplined execution, and reliable tools. Whether you are building an equity portfolio or refining your trading strategies, staying informed is essential.
Track Real-Time Market Data: Stay updated with live index quotes and corporate disclosures on the Official BSE India Portal.
Analyze Historical Trends: Review market data, historical charts, and technical metrics on Investing.com India Markets.
Follow Regulatory Updates: Keep track of investor protection guidelines and market developments on the SEBI Official Website.
Comments